
GeneOntology 分析
基因的本体论(Gene Ontology,GO)注释项目对基因功能进行了一致性描述,开发了可控制的词汇表,且无物种特异性。目前已经建立了三大独立的本体论词汇表:生物过程(biologicalprocess)、细胞组分(cellular component)和分子功能(molecular function)。这三大本体论词条下面又可以独立出不同的亚层次,以“有向非循环图(directed acyclicgraphs)”的方式层层向下,将每一个本体论词条串联起来形成树状结构。将GO词条分配给基因序列的行为即GO注释。目前,GO注释已经成为高通量测序序列的主要注释方法。
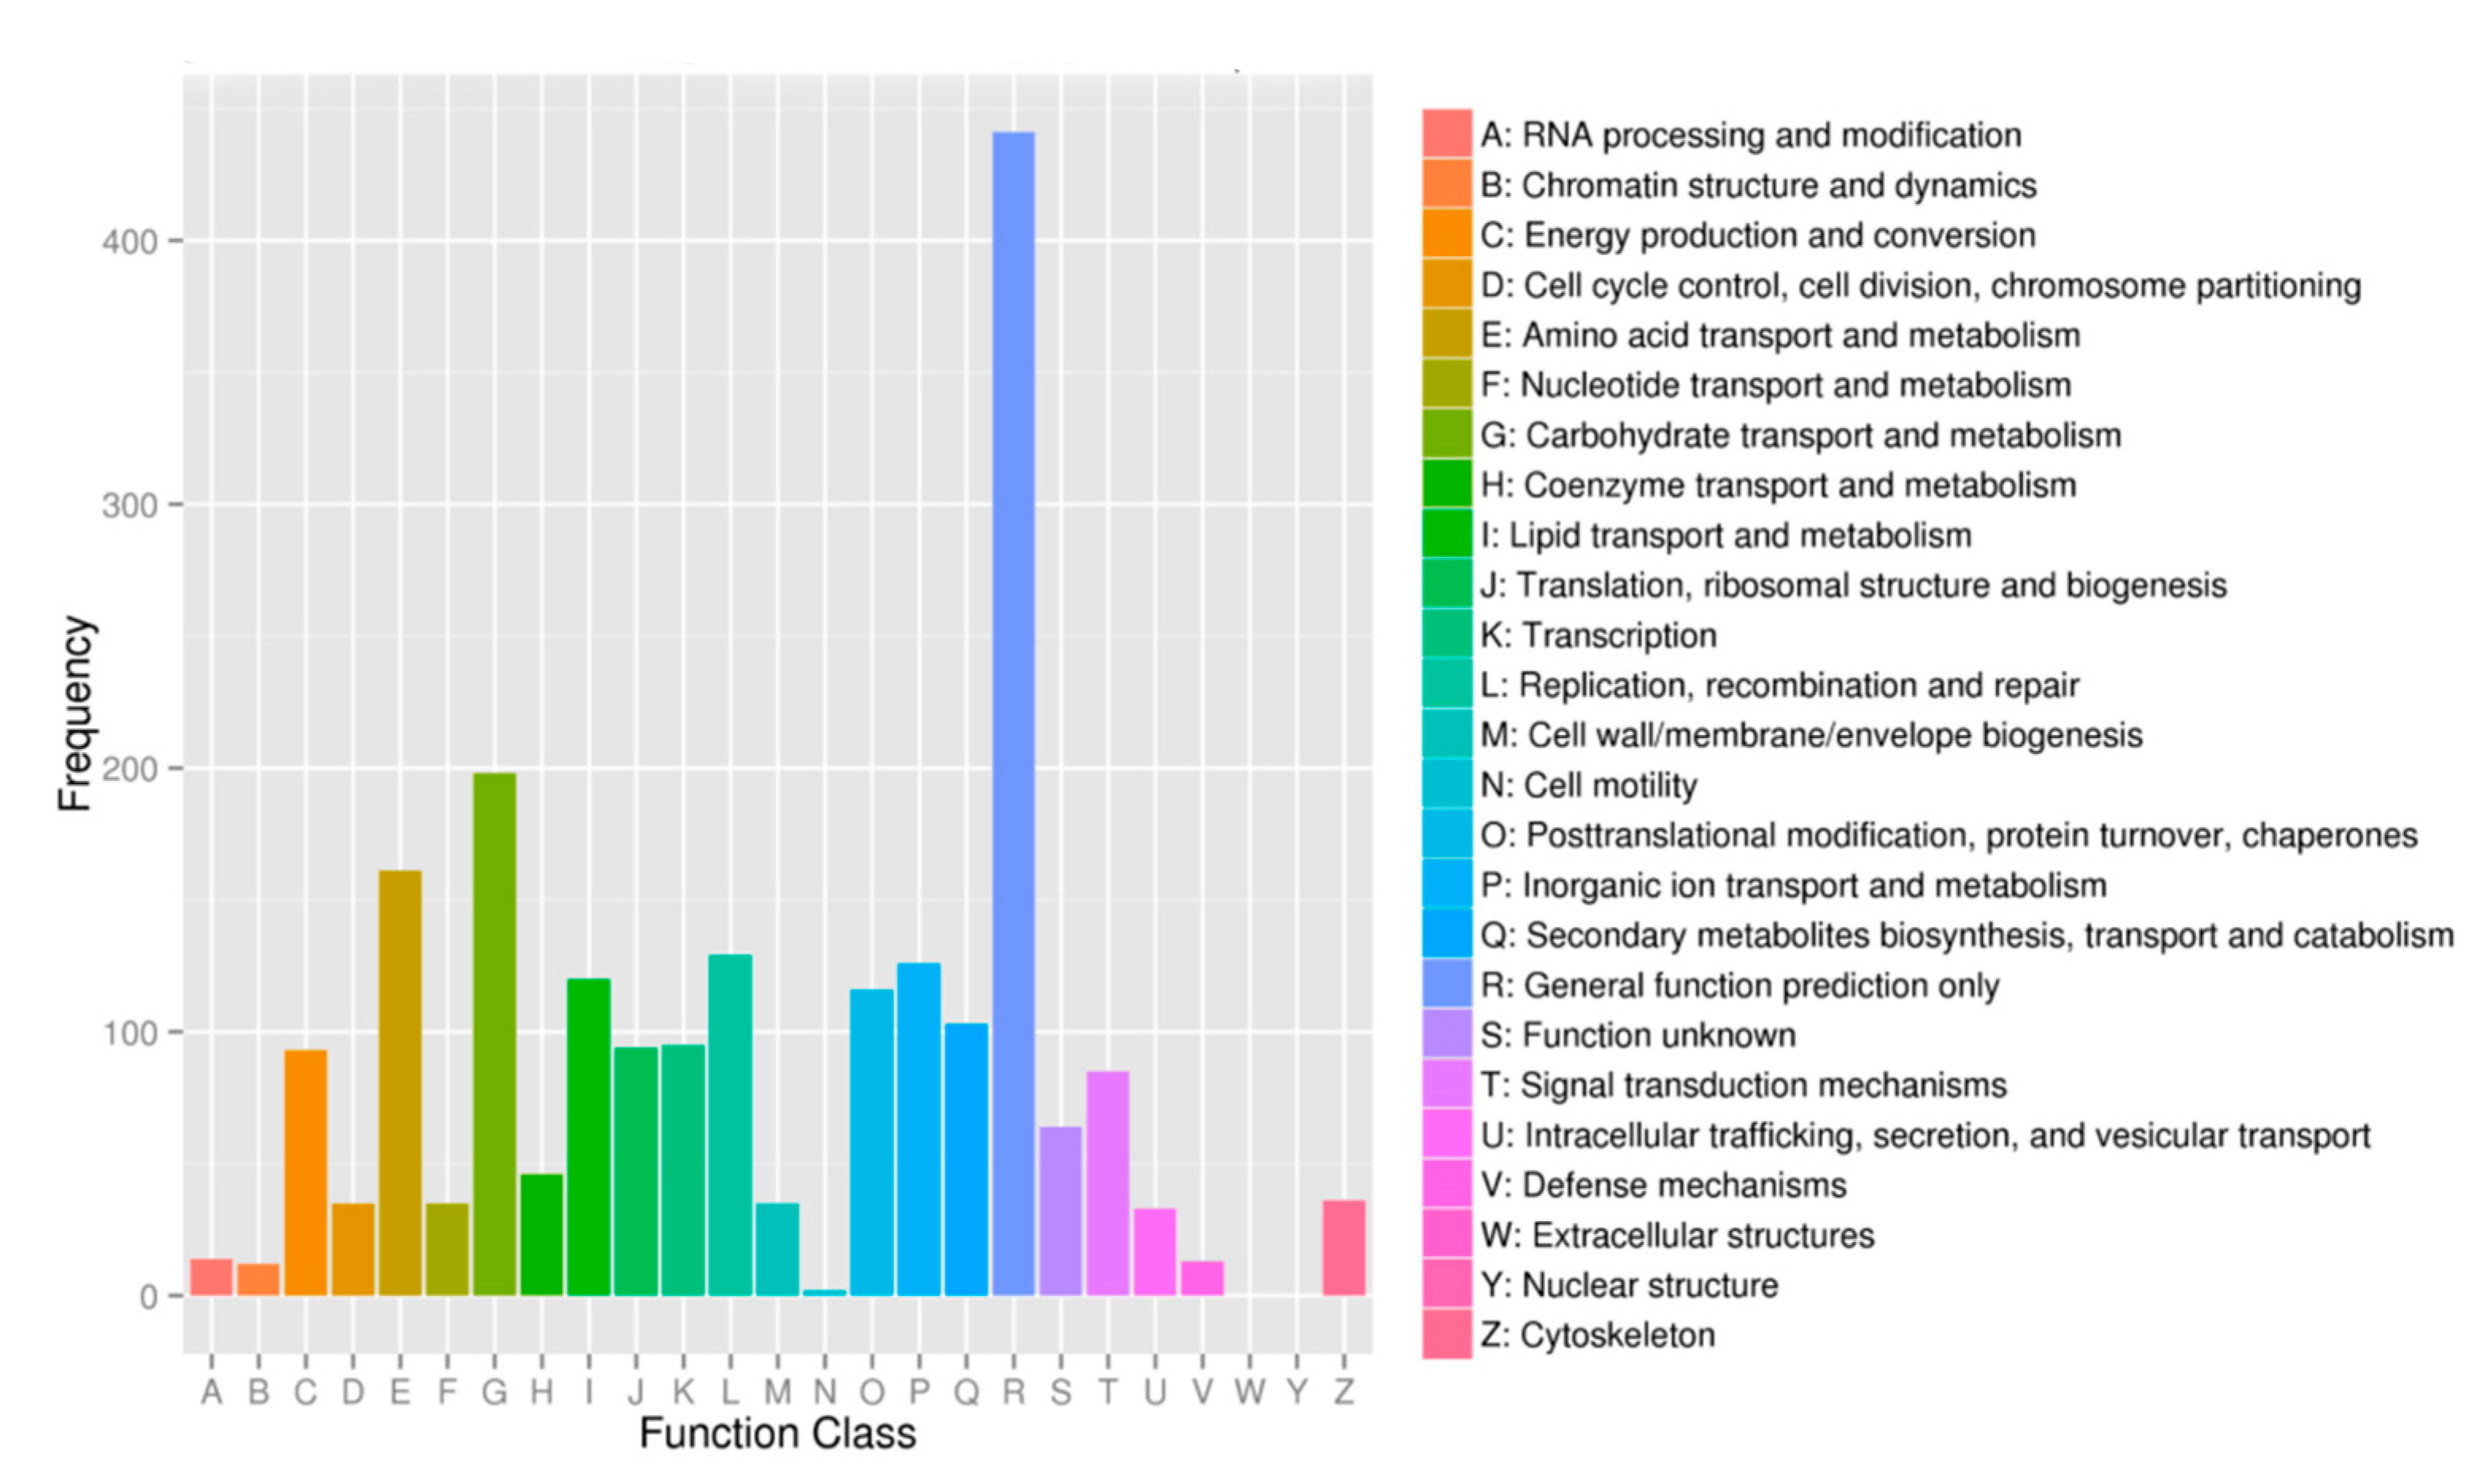
GO注释分析 GO富集分析 GO个性化作图 COG分析
GO功能分类是在某一功能层次上统计蛋白或者基因的数目或组成,往往是在GO的第二层次。此外也有研究都挑选一些Term,而后统计直接对应到该Term的基因或蛋白数。目的是展示数据集大概的GO功能情况。
1. GO功能注释柱形图,基于蛋白质序列同源比对的结果,获得蛋白质的潜在功能:
![]()
Figure 1. Annotation of the Sinocyclocheilus transcriptome. Blast2GO was used to annotate our de novo assembled transcriptome using parameters described in Materials and Methods.
Refference:Meng F, Braasch I, Phillips J B, et al. Evolution of the eye transcriptome under constant darkness in Sinocyclocheilus cavefish[J]. Molecular biology and evolution, 2013, 30(7): 1527-1543.
2. 蛋白质在BP,MF和CC的level2水平分布饼状图:
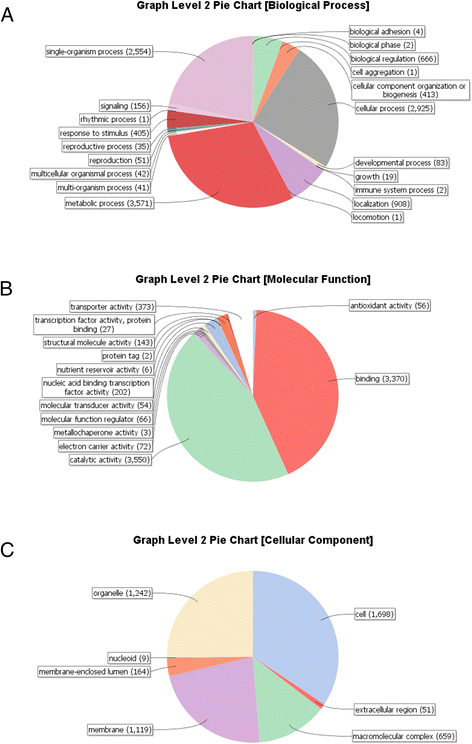
Figure 2. Distribution of Blast2GO gene ontology (GO) categories from the putative Ramularia collo-cygni gene model annotation. a Biological processes, b Molecular function, c Cellular component
Refference:McGrann G R D, Andongabo A, Sjökvist E, et al. The genome of the emerging barley pathogen Ramularia collo-cygni[J]. BMC genomics, 2016, 17(1): 584.
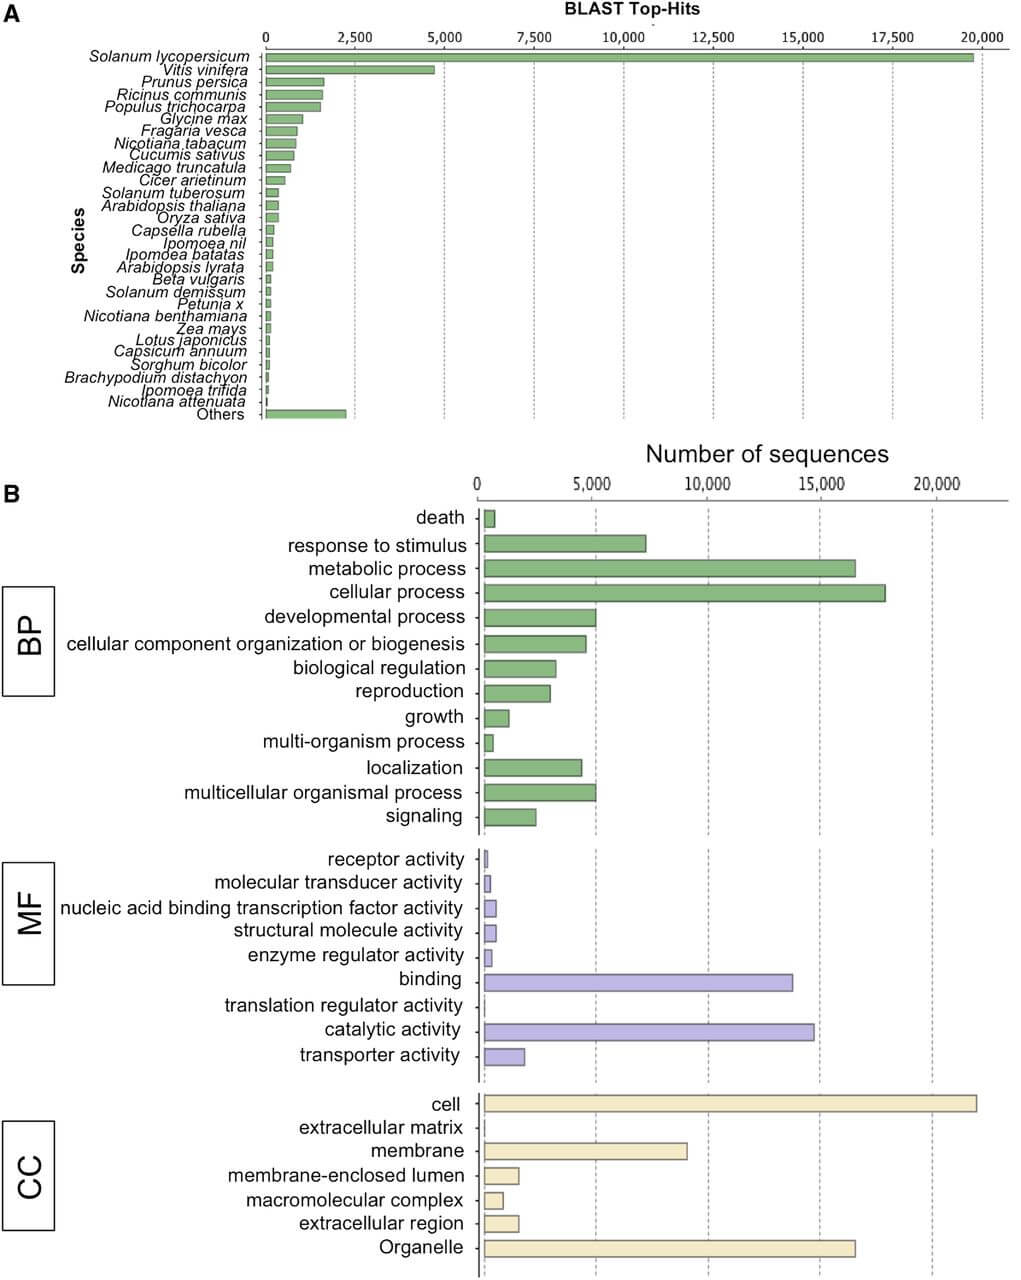
Figure 3. Blast2GO annotation of Dodder_final_transcriptome. A, Top-hit species distribution of the Dodder_final_transcriptome showing the abundance of top hits to the sequences from members of the family Solanaceae. B, GO category distribution of dodder transcripts among level 1 GO categories: biological process (BP), molecular function (MF), and cellular component (CC).
Refference:Ranjan A, Ichihashi Y, Farhi M, et al. De novo assembly and characterization of the transcriptome of the parasitic weed dodder identifies genes associated with plant parasitism[J]. Plant Physiology, 2014, 166(3): 1186-1199.
对于一列基因或者蛋白质,通过GO分析很容易得到他们的分布趋势,一般可以通过饼图和柱形图等形式展现出来。比如功能A的分布比率高于功能B,但是根据这个比率认为A的比率高于B的结论通常是错误的,这些比率说明不了问题,如果把整个物种的基因或者部分基因的分布做为背景进行考虑的话,可能功能B更有意义一些。这个时候就需要进行富集分析。富集分析方法通常是分析一组基因在某个功能结点上是否过出现(over-presentation)。这个原理可以由单个基因的注释分析发展到大基因集合的成组分析。由于分析的结论是基于一组相关的基因,而不是根据单个基因,所以富集分析方法增加了研究的可靠性,同时也能够识别出与生物现象最相关的生物过程。
在蛋白质组学数据分析中,差异蛋白的功能富集分析是将差异蛋白列表中的蛋白与参考物种的全部蛋白列表或实验鉴定到的所有蛋白列表根据GO功能的注释结果进行对照比较,通过Fisher精确检验 (Fisher’s Exact Test),得出两者差异的显著性,从而找到这个差异蛋白列表中富集的功能类别条目,找到一个蛋白列表的功能特性。不同于蛋白功能注释以蛋白为单位进行注释,差异蛋白的功能富集分析以GO功能条目为单位,结果可以直接揭示整个差异蛋白列表中蛋白的整体功能富集特征。
GO富集分析图例展示:
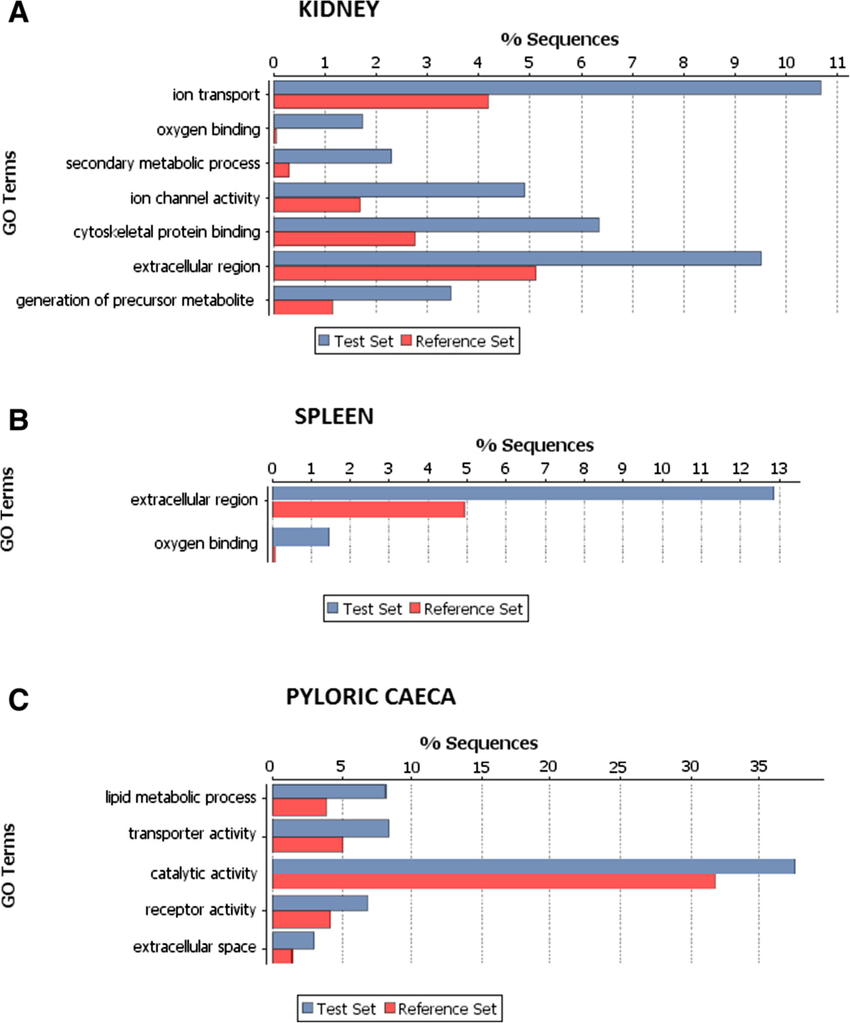
Figure1 Refference:Robledo D, Ronza P, Harrison P W, et al. RNA-seq analysis reveals significant transcriptome changes in turbot (Scophthalmus maximus) suffering severe enteromyxosis[J]. Bmc Genomics, 2014, 15(1): 1149.
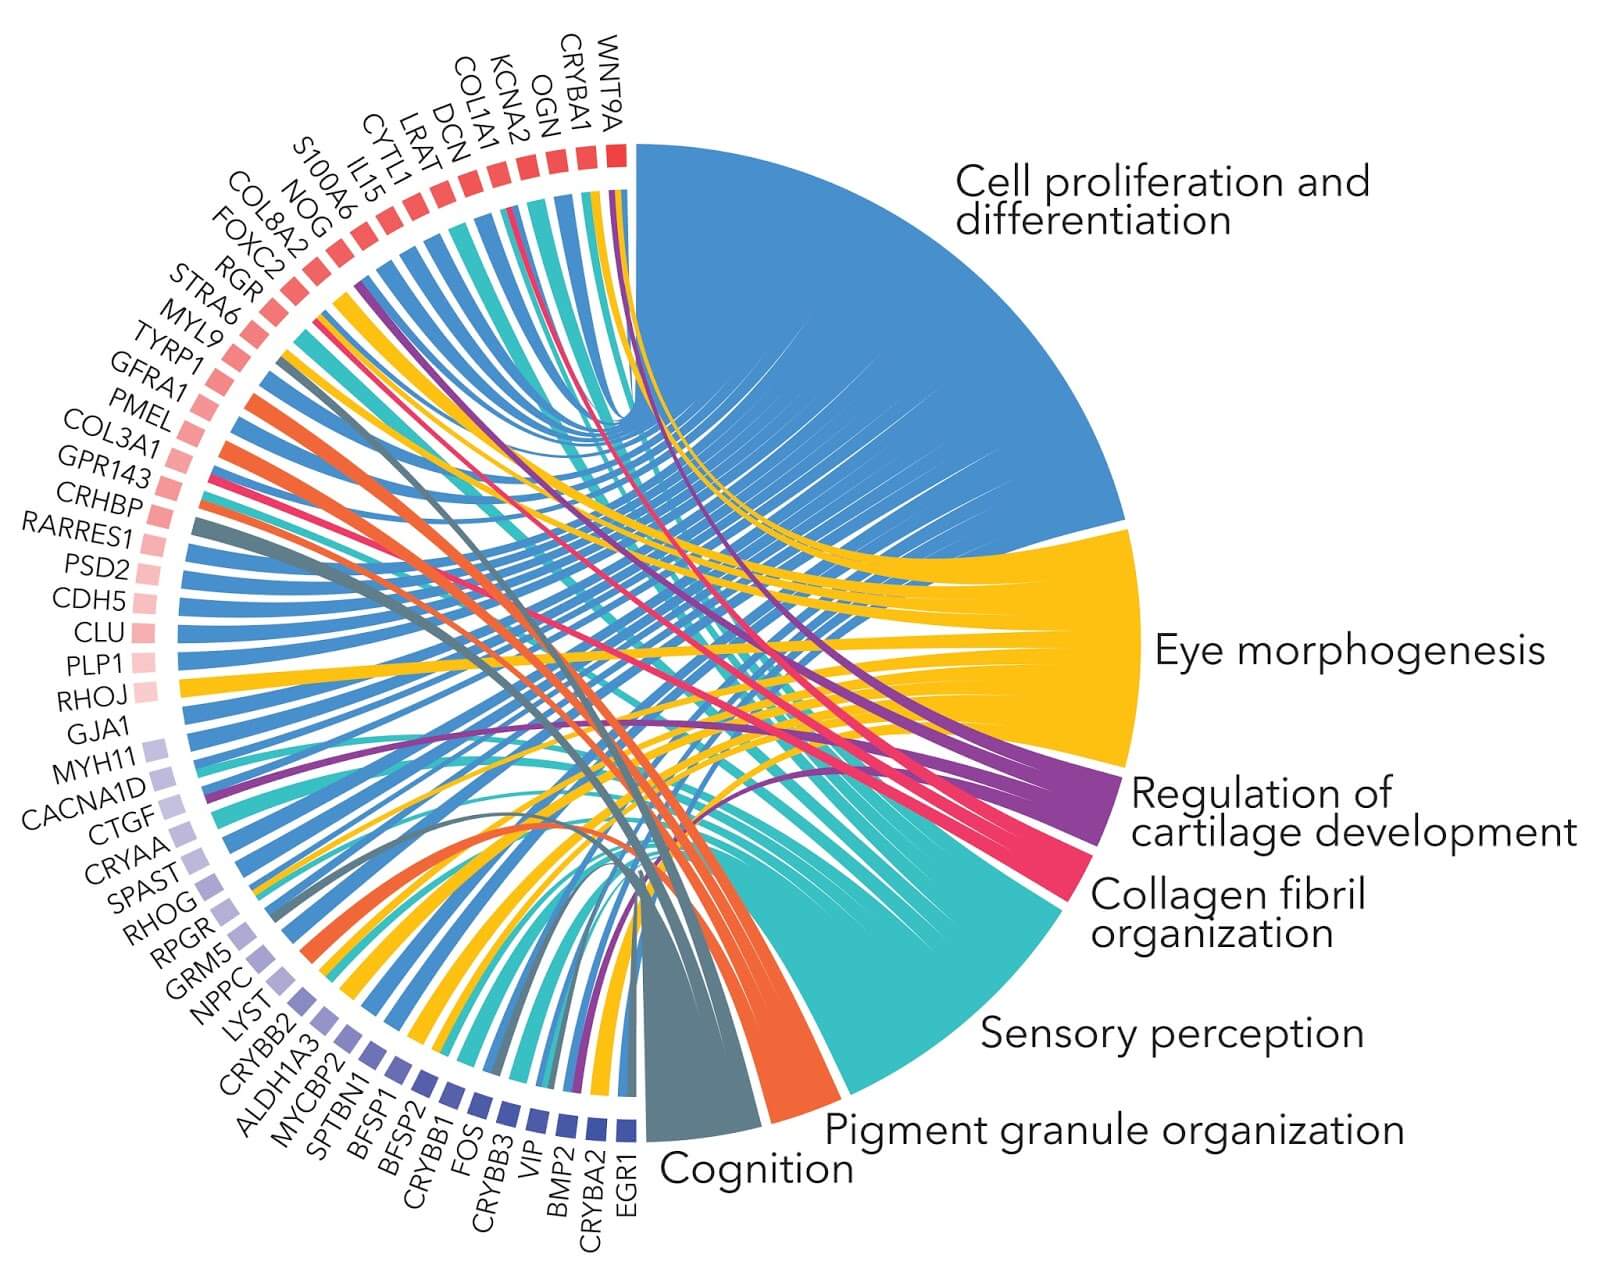
基于GO注释和富集分析的基础上,结合研究目的对特定的GO结果进行更直观图形展示。
GO个性化作图展示:
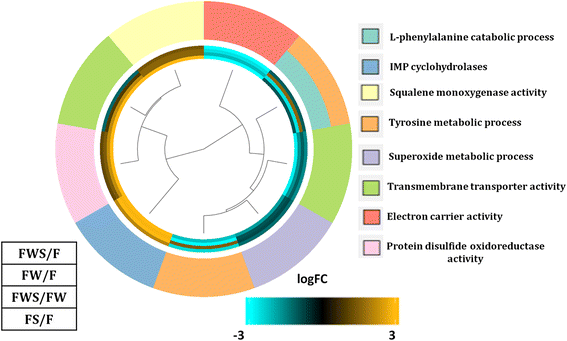
Figure 1. Gene Ontology (GO) of biological process categories with enrichment and showing differentially expressed genes in all the contrasting conditions evaluated (FDR < 0.05). The color key indicates logFC values ranging from golden for up-regulated genes, to cyan for down-regulated genes. The dendrogram indicates the relationship through the hierarchical clustering of gene expression (the middle rings show from the center out: effect on L. theobromae gene expression of heat stress (HS) and grapevine wood (FWS/F), only grapevine wood (FW/F), only HS (FS/F), and effect of HS in the presence of grapevine wood (FWS/FW). The Biological Process GOterms are indicated in different colors on the outermost circle
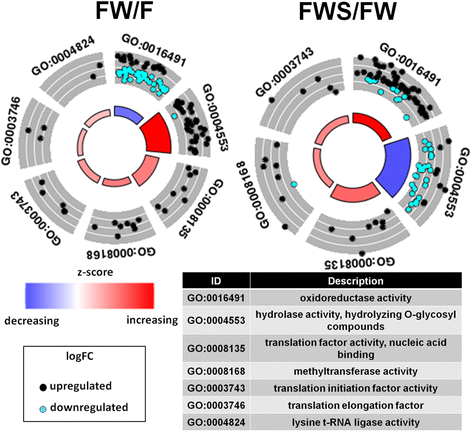
Figure 2. Gene Ontology (GO) of molecular functions categories with enrichment in hierarchical clusters of similar expression profiles. The GO term differential expression is considered through z-score . Red color indicates higher proportion of up-regulated genes and blue color corresponds to higher proportion of down-regulated genes. The color key indicates logFC values ranging from golden for up-regulated genes, to cyan for down-regulated genes. The effects of only grapevine wood (FW/F) and heat stress in the presence of grapevine wood (FWS/FW) were evaluated
Reference:Paolinelli-Alfonso M, Villalobos-Escobedo J M, Rolshausen P, et al. Global transcriptional analysis suggests Lasiodiplodia theobromae pathogenicity factors involved in modulation of grapevine defensive response[J]. BMC genomics, 2016, 17(1): 615.
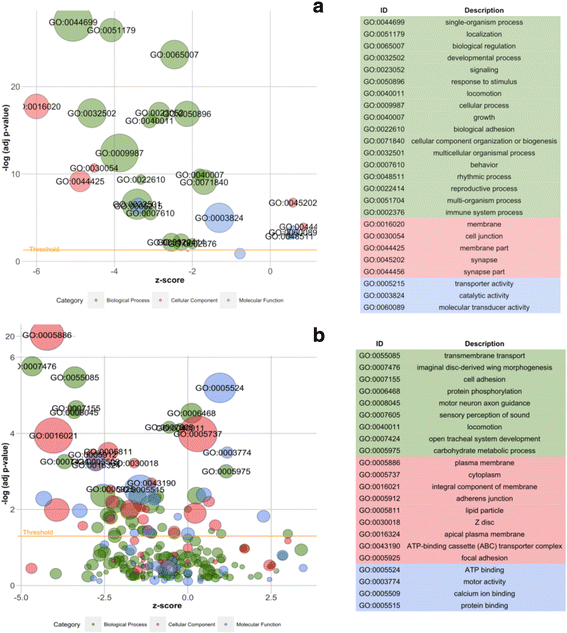
Figure 3. Bubble plots showing enriched GO terms generated from sex-biased genes. “Z-score” was calculated for each term using the formula: male-biased minus female-biased gene number divided by the square root of sex-biased gene number. The significant GOs are indicated above the yellow line. The bubbles calculated with minus z-scores represent GOs containing more female-biased genes, while GOs with more male-biased genes have z-scores larger than zero. The bubble size represents the number of genes. The GO descriptions on the right are listed from the highest to lowest significance of enrichment. (a) Level one terms; (b) after removing all parental terms
Reference:Wu C, Twort V G, Crowhurst R N, et al. Assembling large genomes: analysis of the stick insect (Clitarchus hookeri) genome reveals a high repeat content and sex-biased genes associated with reproduction[J]. BMC genomics, 2017, 18(1): 884.
“COG”是Cluster of Orthologous Groups of proteins.构成每个COG的蛋白都是被假定为来自于一个祖先蛋白,并且因此或者是orthologs或者是paralogs。Orthologs是指来自于不同物种的由垂直家系(物种形成)进化而来的蛋白,并且典型的保留与原始蛋白有相同的功能。Paralogs是那些在一定物种中的来源于基因复制的蛋白,可能会进化出新的与原来有关的功能。